
Table of Contents
- Claude Skills คืออะไร?
- ทำไมต้องสร้าง Custom Skill?
- Architecture ของ Financial Report Skill
- Step 1: สร้างโครงสร้าง Skill
- Step 2: เขียน SKILL.md
- Step 3: สร้าง Reference Files
- Font Standards
- Column Widths
- Step 4: สร้าง Validation Script
- Step 5: สร้าง Template (Optional)
- Full SKILL.md Template (Copy & Paste Ready)
- Formula Standards
- Validation Checklist
- References
- Error Handling
- ตัวอย่างการใช้งานจริง
- Tips สำหรับการปรับแต่ง
- Conclusion
หลังจากที่ Anthropic เปิดตัว Claude Skills ไปเมื่อเดือนตุลาคม 2025 หลายๆ องค์กรก็เริ่มนำไปใช้งานจริงกันแล้ว โดยเฉพาะในสาย Financial Services ที่ Rakuten รายงานว่าสามารถ ลดเวลาทำงานได้ถึง 87.5% — งานที่เคยใช้เวลาทั้งวันเหลือแค่ชั่วโมงเดียว
วันนี้ผมจะพาทุกคนมาสร้าง Custom Claude Skill สำหรับ Financial Report Generator แบบ step-by-step พร้อม template ที่ copy/paste ได้เลย
Claude Skills คืออะไร?
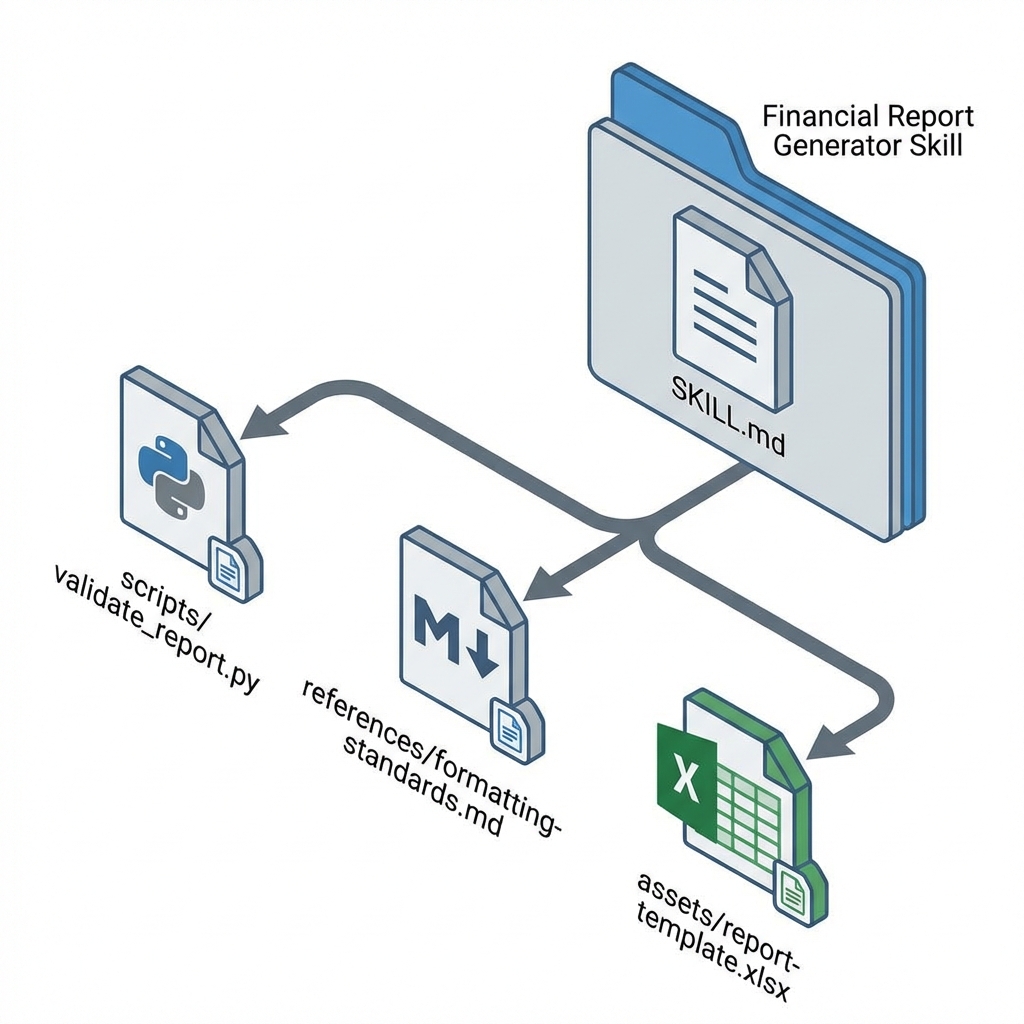
Claude Skills คือ modular packages ที่ช่วยเพิ่มความสามารถให้ Claude ในงานเฉพาะทาง โดยแต่ละ Skill จะประกอบด้วย:
- SKILL.md — ไฟล์หลักที่บอก Claude ว่าต้องทำอะไร
- scripts/ — Python/Bash scripts สำหรับงานที่ต้องการความแม่นยำ
- references/ — เอกสารอ้างอิงที่ Claude จะอ่านเมื่อจำเป็น
- assets/ — templates, fonts หรือไฟล์อื่นๆ ที่ใช้ในการสร้าง output
สิ่งที่น่าสนใจคือ Claude จะ automatically detect ว่าควรใช้ Skill ไหนตาม context ของงาน — ไม่ต้อง manually select
ทำไมต้องสร้าง Custom Skill?
Anthropic มี pre-built Skills สำหรับงานทั่วไปอยู่แล้ว เช่น xlsx, pptx, docx แต่สำหรับงานที่ต้องการ:
✅ Format เฉพาะองค์กร — สี, font, layout ตาม brand guidelines
✅ Business logic เฉพาะ — สูตรคำนวณ KPIs ของบริษัท
✅ Workflow ซ้ำๆ — Monthly reports, quarterly analysis
✅ Domain knowledge — terminology, accounting standards
Custom Skill จะช่วยให้ Claude เข้าใจ context เหล่านี้โดยไม่ต้องอธิบายซ้ำทุกครั้ง
Architecture ของ Financial Report Skill
financial-report-generator/
├── SKILL.md                    # Main instructions
├── references/
│   ├── formatting-standards.md # Color codes, number formats
│   ├── kpi-definitions.md      # KPI calculation formulas
│   └── report-templates.md     # Report structure guidelines
├── scripts/
│   └── validate_report.py      # Verify calculations
└── assets/
    └── report-template.xlsx    # Excel template with branding
Step 1: สร้างโครงสร้าง Skill
เริ่มจากสร้าง folder structure:
mkdir -p financial-report-generator/{references,scripts,assets}
cd financial-report-generator
Step 2: เขียน SKILL.md
นี่คือหัวใจหลักของทุก Skill — ไฟล์ที่บอก Claude ว่าต้องทำอะไร
---
name: financial-report-generator
description: "Generates standardized financial reports with company-specific formatting, KPI calculations, and automated validation. Use this skill when: (1) Creating monthly/quarterly financial reports, (2) Generating P&L statements with variance analysis, (3) Building budget vs actual comparisons, (4) Producing executive summary dashboards"
---
# Financial Report Generator
Generate professional financial reports following company standards.
## Report Types Supported
1. **Monthly P&L Report** — Income statement with variance analysis
2. **Budget vs Actual** — Comparison with variance percentages
3. **Cash Flow Statement** — Operating, investing, financing activities
4. **Executive Dashboard** — KPIs summary for management review
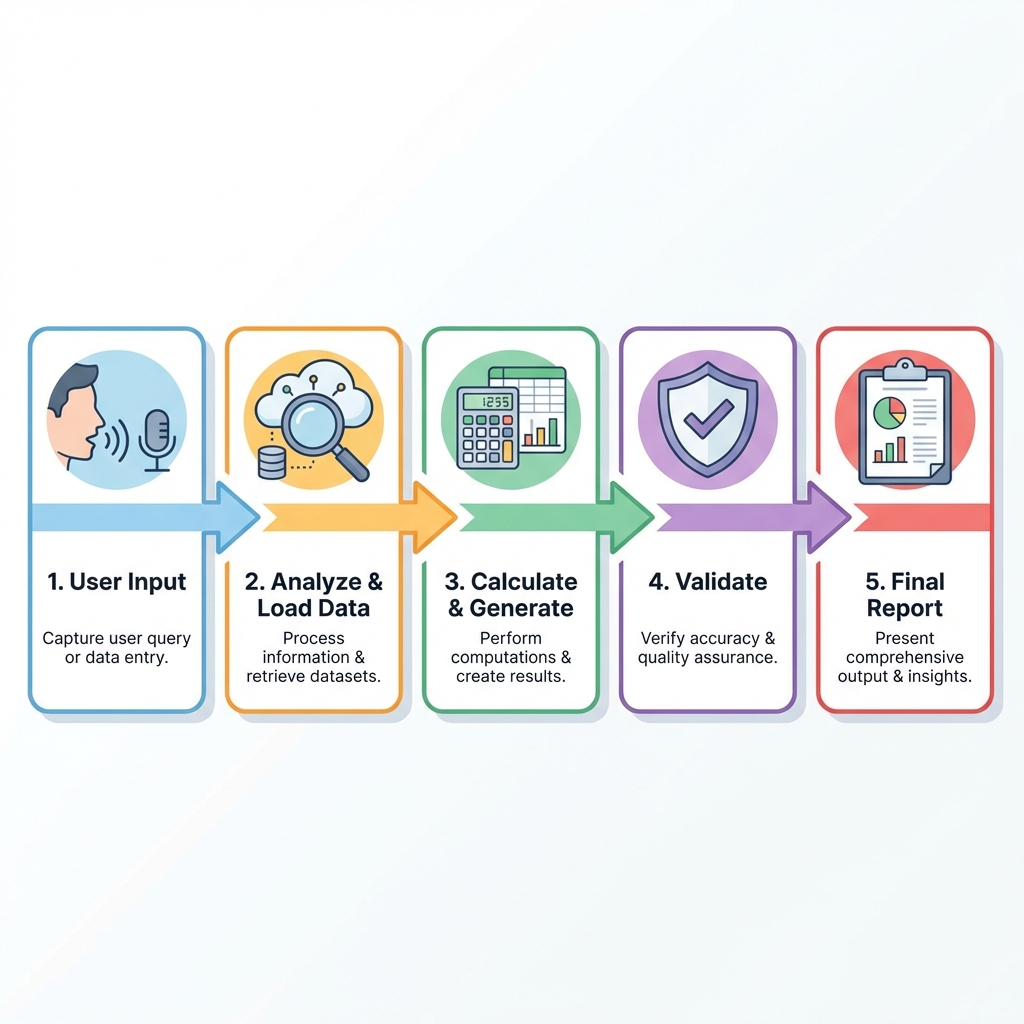
## Workflow
1. **Analyze request** — Identify report type and required data
2. **Load data** — Read from uploaded files or user input
3. **Apply calculations** — Use formulas from references/kpi-definitions.md
4. **Generate report** — Create Excel file with proper formatting
5. **Validate** — Run scripts/validate_report.py to check for errors
6. **Deliver** — Output final report with summary
## Formatting Standards
See `references/formatting-standards.md` for detailed color codes and number formats.
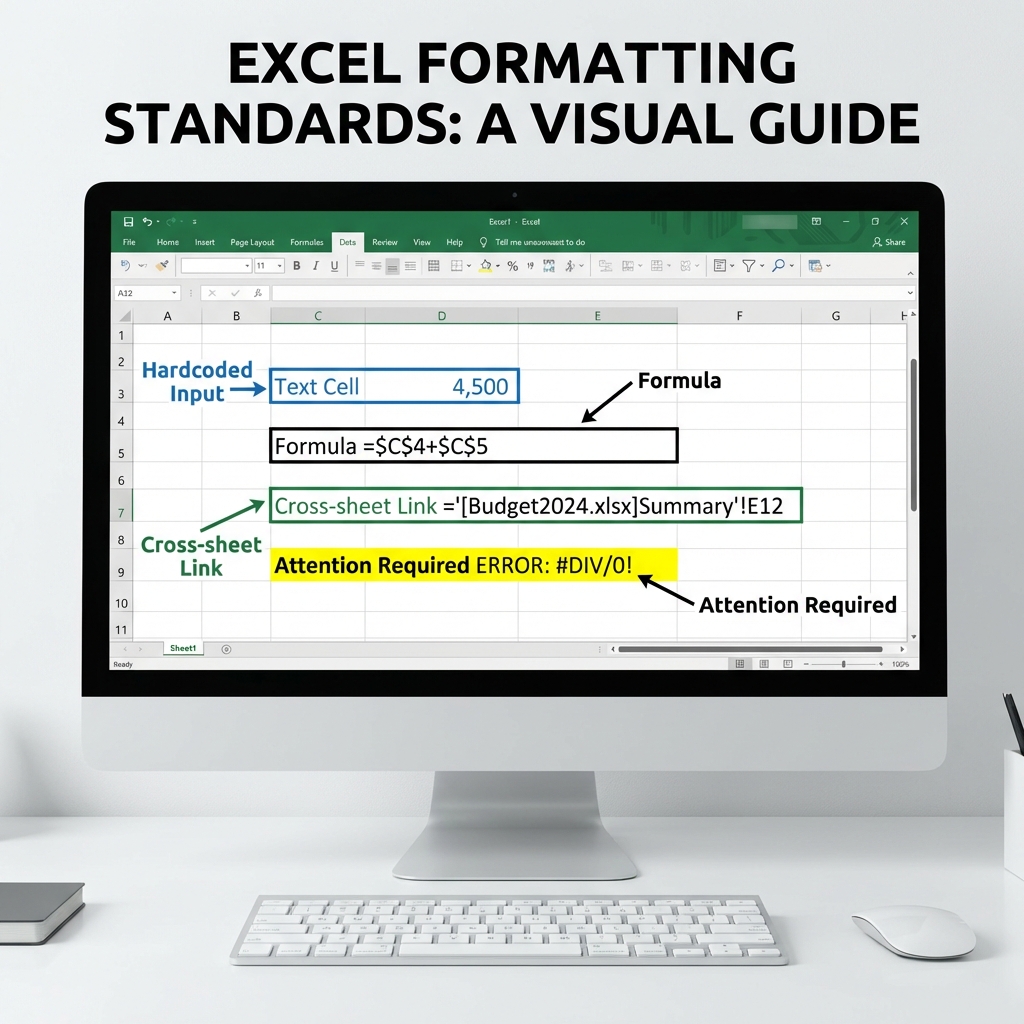
### Quick Reference
- **Blue text** (RGB: 0,0,255) — Hardcoded inputs
- **Black text** (RGB: 0,0,0) — Formulas and calculations
- **Green text** (RGB: 0,128,0) — Cross-sheet references
- **Yellow highlight** — Cells requiring attention
### Number Formats
| Type | Format | Example |
| ---------- | ----------- | ------------- |
| Currency | $#,##0 | $1,234,567 |
| Percentage | 0.0% | 15.5% |
| Variance | +0.0%;-0.0% | +5.2% / -3.1% |
| Multiples | 0.0x | 2.5x |
## Critical Rules
1. **NEVER hardcode calculations** — Always use Excel formulas
2. **Document all assumptions** — Add comments for key inputs
3. **Zero formula errors** — No #REF!, #DIV/0!, #VALUE!, #N/A
4. **Recalculate before delivery** — Run recalc.py after generation
Step 3: สร้าง Reference Files
references/formatting-standards.md
# Financial Report Formatting Standards

## Color Coding (Industry Standard)

### Text Colors

| Purpose           | RGB Code  | Hex     | Usage                        |
| ----------------- | --------- | ------- | ---------------------------- |
| Hardcoded inputs  | (0,0,255) | #0000FF | Values that users can modify |
| Formulas          | (0,0,0)   | #000000 | All calculated cells         |
| Cross-sheet links | (0,128,0) | #008000 | References to other sheets   |
| External links    | (255,0,0) | #FF0000 | Links to other workbooks     |

### Background Colors

| Purpose         | RGB Code      | Hex     | Usage                   |
| --------------- | ------------- | ------- | ----------------------- |
| Key assumptions | (255,255,0)   | #FFFF00 | Cells needing attention |
| Header rows     | (68,114,196)  | #4472C4 | Table headers           |
| Subtotals       | (217,225,242) | #D9E1F2 | Summary rows            |

## Number Formatting

### Currency Formats
Standard currency (millions)
$#,##0;($#,##0);-
With decimals
$#,##0.00;($#,##0.00);-
### Percentage Formats
Standard percentage
0.0%;(0.0%);-
Variance format (shows + sign)
+0.0%;-0.0%;-
### Year Format

**IMPORTANT**: Years must be formatted as text to prevent comma display.

```python
# Wrong: 2,024
# Correct: 2024

cell.number_format = '@'  # Text format
cell.value = '2024'
Font Standards
- Primary font: Arial 10pt
- Headers: Arial 11pt Bold
- Titles: Arial 14pt Bold
- Notes: Arial 9pt Italic
Column Widths
| Column Type | Width | Example |
|---|---|---|
| Row labels | 35 | Account names |
| Monthly data | 12 | Jan, Feb, etc. |
| Totals | 15 | Annual totals |
| Variance | 10 | % change |
### references/kpi-definitions.md

```markdown
# KPI Definitions and Formulas

## Profitability Metrics

### Gross Margin
Gross Margin % = (Revenue - COGS) / Revenue × 100
**Excel Formula:**
=(Revenue-COGS)/Revenue
### Operating Margin
Operating Margin % = Operating Income / Revenue × 100
**Excel Formula:**
=(Revenue-COGS-OpEx)/Revenue
### Net Profit Margin
Net Profit Margin % = Net Income / Revenue × 100
### EBITDA
EBITDA = Operating Income + Depreciation + Amortization
## Growth Metrics

### Year-over-Year Growth
YoY Growth = (Current Period - Prior Period) / Prior Period × 100
**Excel Formula:**
=(C5-B5)/ABS(B5)
**Note**: Use ABS() to handle negative base values correctly.

### Month-over-Month Growth
MoM Growth = (Current Month - Prior Month) / Prior Month × 100
## Variance Analysis

### Budget Variance
Budget Variance = Actual - Budget Variance % = (Actual - Budget) / Budget × 100
**Excel Formula:**
=Actual-Budget =(Actual-Budget)/ABS(Budget)
### Favorable vs Unfavorable

- **Revenue**: Positive variance = Favorable
- **Expenses**: Negative variance = Favorable

## Liquidity Ratios

### Current Ratio
Current Ratio = Current Assets / Current Liabilities
### Quick Ratio
Quick Ratio = (Current Assets - Inventory) / Current Liabilities
## Efficiency Metrics

### Days Sales Outstanding (DSO)
DSO = (Accounts Receivable / Revenue) × Days in Period
### Inventory Turnover
Inventory Turnover = COGS / Average Inventory
Step 4: สร้าง Validation Script
scripts/validate_report.py
#!/usr/bin/env python3
"""
Financial Report Validator
Checks for common errors in generated Excel reports.
"""

import json
import sys
from openpyxl import load_workbook

def validate_report(filepath: str) -> dict:
    """Validate financial report for common errors."""

    results = {
        "status": "success",
        "errors": [],
        "warnings": [],
        "checks_passed": []
    }

    try:
        wb = load_workbook(filepath, data_only=True)
    except Exception as e:
        results["status"] = "error"
        results["errors"].append(f"Cannot open file: {str(e)}")
        return results

    excel_errors = ['#REF!', '#DIV/0!', '#VALUE!', '#N/A', '#NAME?', '#NULL!', '#NUM!']
    error_locations = []

    for sheet in wb.worksheets:
        for row in sheet.iter_rows():
            for cell in row:
                if cell.value in excel_errors:
                    error_locations.append({
                        "sheet": sheet.title,
                        "cell": cell.coordinate,
                        "error": cell.value
                    })

    if error_locations:
        results["status"] = "errors_found"
        results["errors"].append({
            "type": "formula_errors",
            "count": len(error_locations),
            "locations": error_locations[:10]  # First 10 only
        })
    else:
        results["checks_passed"].append("No formula errors found")

    # Check for required sheets
    required_sheets = ['Summary', 'P&L', 'Assumptions']
    missing = [s for s in required_sheets if s not in wb.sheetnames]

    if missing:
        results["warnings"].append(f"Missing recommended sheets: {', '.join(missing)}")
    else:
        results["checks_passed"].append("All recommended sheets present")

    wb.close()
    return results

if __name__ == "__main__":
    if len(sys.argv) < 2:
        print("Usage: python validate_report.py <excel_file>")
        sys.exit(1)

    result = validate_report(sys.argv[1])
    print(json.dumps(result, indent=2))
Step 5: สร้าง Template (Optional)
ถ้าต้องการ branded template สามารถใส่ไฟล์ Excel ใน assets/ folder
assets/
└── report-template.xlsx    # Pre-formatted template with logo, colors
Claude จะ copy template นี้และ populate data ลงไป แทนที่จะสร้างใหม่ทั้งหมด
Full SKILL.md Template (Copy & Paste Ready)
นี่คือ template เต็มที่พร้อมใช้งาน:
---
name: financial-report-generator
description: "Generates standardized financial reports with company-specific formatting, KPI calculations, and automated validation. Use this skill when: (1) Creating monthly/quarterly financial reports, (2) Generating P&L statements with variance analysis, (3) Building budget vs actual comparisons, (4) Producing executive summary dashboards, (5) User mentions 'financial report', 'P&L', 'budget analysis', or 'quarterly report'"
---

# Financial Report Generator

Generate professional financial reports following company standards.

## Quick Start

When user requests a financial report:

1. Identify report type (P&L, Budget vs Actual, Cash Flow, Dashboard)
2. Collect required data from user
3. Generate Excel with proper formatting
4. Validate with `scripts/validate_report.py`
5. Deliver with executive summary

## Report Types

### 1. Monthly P&L Report

Structure:

- Sheet 1: Executive Summary
- Sheet 2: Detailed P&L (by month)
- Sheet 3: YoY Comparison
- Sheet 4: Assumptions

Required data:

- Revenue by category
- COGS breakdown
- Operating expenses
- Prior year comparables

### 2. Budget vs Actual

Structure:

- Sheet 1: Summary Dashboard
- Sheet 2: Revenue Analysis
- Sheet 3: Expense Analysis
- Sheet 4: Variance Details

Required data:

- Actual figures (current period)
- Budget figures
- Prior year actuals (optional)

### 3. Cash Flow Statement

Structure:

- Sheet 1: Cash Flow Summary
- Sheet 2: Operating Activities
- Sheet 3: Investing Activities
- Sheet 4: Financing Activities

### 4. Executive Dashboard

Structure:

- Sheet 1: KPI Summary (single page)
- Sheet 2: Trend Charts
- Sheet 3: Supporting Data

## Formatting Rules

### Colors (ALWAYS APPLY)

```python
from openpyxl.styles import Font, PatternFill

# Define standard colors
BLUE_INPUT = Font(color="0000FF")      # Hardcoded inputs
BLACK_FORMULA = Font(color="000000")   # Formulas
GREEN_LINK = Font(color="008000")      # Cross-sheet refs
YELLOW_HIGHLIGHT = PatternFill("solid", fgColor="FFFF00")
HEADER_FILL = PatternFill("solid", fgColor="4472C4")
```
Number Formats (ALWAYS APPLY)
# Currency (millions)
cell.number_format = '$#,##0;($#,##0);"-"'

# Percentage
cell.number_format = '0.0%'

# Variance with +/- sign
cell.number_format = '+0.0%;-0.0%;"-"'

# Year as text
cell.number_format = '@'
Formula Standards
CRITICAL: Never Hardcode Calculations
❌ Wrong:
total = sum(values)
sheet['B10'] = total  # Hardcoded!
✅ Correct:
sheet['B10'] = '=SUM(B2:B9)' # Excel formula
Common Formulas
# Growth rate
'=(C5-B5)/ABS(B5)'

# Margin percentage
'=B5/B$15'  # Absolute reference for total

# Budget variance
'=C5-D5'

# Variance percentage
'=(C5-D5)/ABS(D5)'

# Running total
'=SUM($B$2:B2)'
Validation Checklist
Before delivering ANY report:
- Run
scripts/validate_report.py - Zero formula errors (#REF!, #DIV/0!, etc.)
- All input cells are blue
- All formula cells are black
- Numbers formatted correctly
- Years display without commas
References
references/formatting-standards.md— Detailed color codes and formatsreferences/kpi-definitions.md— KPI calculation formulas
Error Handling
If validation fails:
- Identify error type from JSON output
- Locate problematic cells
- Fix formula references
- Re-run validation
- Only deliver when status = “success”
---

## การติดตั้งและใช้งาน

### สำหรับ Claude.ai

1. ไปที่ **Settings > Features**
2. Enable **Code execution and file creation**
3. Upload skill folder เป็น ZIP file

### สำหรับ Claude Code

```bash
# Copy skill to Claude's skill directory
cp -r financial-report-generator ~/.claude/skills/

# หรือใช้ plugin system
/plugin add ./financial-report-generator
สำหรับ API
import anthropic

client = anthropic.Client()

response = client.beta.messages.create(
    model="claude-sonnet-4-5-20250929",
    max_tokens=4096,
    container={
        "skills": [{
            "type": "custom",
            "skill_id": "financial-report-generator",
            "version": "latest"
        }]
    },
    messages=[{
        "role": "user",
        "content": "Generate a monthly P&L report for January 2026..."
    }]
)
ตัวอย่างการใช้งานจริง
เมื่อติดตั้ง Skill แล้ว สามารถใช้งานได้ง่ายๆ:
Prompt:
“สร้าง Monthly P&L Report สำหรับเดือนมกราคม 2026 Revenue: 5.2M, COGS: 2.1M, OpEx: 1.8M เทียบกับ Budget: Revenue 5.0M, COGS 2.0M, OpEx 1.9M”
Claude จะ:
- ✅ สร้าง Excel file with multiple sheets
- ✅ Apply correct formatting (blue inputs, black formulas)
- ✅ Calculate variances using Excel formulas
- ✅ Run validation script
- ✅ Deliver report with executive summary
Tips สำหรับการปรับแต่ง
1. เพิ่ม Company-Specific KPIs
แก้ไข references/kpi-definitions.md เพิ่ม KPIs ของบริษัท
2. ปรับ Branding
- เปลี่ยน color codes ใน
formatting-standards.md - ใส่ logo ใน
assets/logo.png - สร้าง branded template ใน
assets/
3. เพิ่ม Report Types
เพิ่ม sections ใน SKILL.md สำหรับ report types อื่นๆ
4. Integrate กับ Data Sources
เพิ่ม scripts สำหรับ pull data จาก:
- Database queries
- API calls
- CSV/Excel imports
Conclusion
Claude Skills เป็น game changer สำหรับงาน automation โดยเฉพาะ financial reporting ที่ต้องการ:
- Consistency — Format เดียวกันทุกครั้ง
- Accuracy — Validation ทุก step
- Speed — ลดเวลาจากวันเหลือชั่วโมง
ลอง copy template ไปใช้และปรับแต่งตาม workflow ของตัวเองดูครับ
มีคำถามหรือต้องการ template เพิ่มเติม? Comment ด้านล่างได้เลยครับ